✔ 데이터 분석 :: Numpy, Pandas(DataFrame)
✔ 시각화 :: Matplot, Seaborn
Pandas
Pandas는 Panel Datas 의 약자
파이썬을 이용한 데이터 분석에서 가장 많이 사용되는 라이브러리이다.
Numpy 기반으로 만들어졌으며 데이터 분석을 하기위한 효율적인 구조를 제공한다.
자료구조
- Series (1차원, Vector)
: 1차원 배열형태의 데이터 구조를 가진다.
별도로 행과 열을 지정해 주지 않으면 인덱스는 리스트처럼 정수로 설정 - DataFrame (2차원, Matrix)
: 2차원 배열 형태의 데이터 구조를 가진다.
가장 많이 사용하는 구조
행을 구분하는 index와 열을 구분하는 column이 있다.
별도로 행과 열을 지정해 주지 않으면 인덱스는 리스트처럼 정수로 설정 - Panel (3차원)
Series 생성, 구조 확인
import numpy as np
import pandas as pd
from pandas import Series, DataFrame
# 시리즈 구조를 먼저 확인
'''
data
index로 구성할 수 있다.
columns 옵션은 빠져있다.
이유는 벡터구조이기 때문이다.
'''

ser1 = Series?
# Series , 기본 인덱스
'''
인덱스를 명시적으로 지정하지 않으면
자동적으로 0~(n-1) 까지의 정수로 잡힌다.
즉, 0,1,2,3,4 는 index , 값을 정해주지 않으면 정수로 표현된다.
'''

np.random.seed(100)
ser1 = Series(np.random.randint(10,20,5)) # 10부터 20사이에 랜덤으로 추출한 5개
print(ser1)

==============================================================

0    18
1    18
2    13
3    17
4    17
dtype: int32
# Series , 인덱스 명시적 지정
'''
인덱스를 명시적으로 지정할때는
반드시 리스트 형태의 값으로 지정한다.
'''

np.random.seed(100)
ser1 = Series(np.random.randint(10,20,5),
             index = list('abcde'))

print(ser1)
====================================================

a    18
b    18
c    13
d    17
e    17
print(ser1.index)
print(ser1.values)
print(ser1.dtype)

======================================================

Index(['a', 'b', 'c', 'd', 'e'], dtype='object')
[18 18 13 17 17]
int32
시리즈 값 조회하기
슬라이싱 방법
1) 숫자사용 :: 마지막 숫자는 포함 되지 않는다.
2) 라벨사용 :: 마지막 라벨은 포함 시킨다.
# 라벨링 인덱싱, 숫자로 인덱싱
print(ser1['c'])
print(ser1[2])


# 숫자로 슬라이싱, 라벨로 슬라이싱
print(ser1[1:4])
print(ser1['b':'d'])

================================================

13
13

b    18
c    13
d    17
dtype: int32

b    18
c    13
d    17
dtype: int32
# 응용해서 조회해보자
# 응용해서 조회해보자.
ser1
ser1_1 = ser1[::2] # 처음부터 끝까지 2만큼 건너뛰면서 슬라이싱
print(ser1_1)

=======================================================

a    18
c    13
e    17
dtype: int32
시리즈간의 연산
# NaN 누락데이터 , float64가 포함되어있음
# Series 는 ndarray class type == np배열이다
print(ser1)
print(ser1_1)

print("*" * 50)

resSer = ser1 + ser1_1
print(resSer)

=================================================

a    18
b    18
c    13
d    17
e    17
dtype: int32
a    18
c    13
e    17
dtype: int32
**************************************************
a    36.0
b     NaN
c    26.0
d     NaN
e    34.0
dtype: float64
누락데이터 조회하기
- isnull()
- notnull()
resSer
print(resSer.isnull())
print(resSer.notnull())
print(resSer.isnull().sum())

===========================================

a    False
b     True
c    False
d     True
e    False
dtype: bool


a     True
b    False
c     True
d    False
e     True
dtype: bool


2
print(resSer[resSer.isnull()]) # boolean expression?
print(resSer[resSer.notnull()])
print(resSer.notnull().sum())
========================================================
b NaN
d NaN
dtype: float64
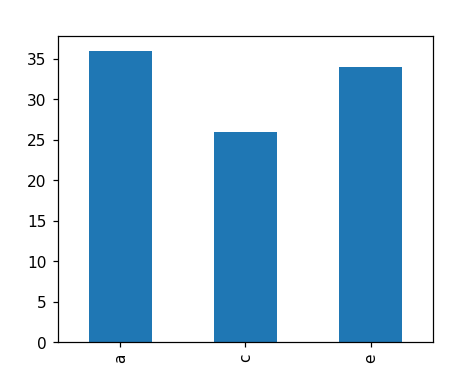
a 36.0
c 26.0
e 34.0
dtype: float64
3
Pandas를 이용한 시각화 (Matplot, Seaborn)
위에서 했던 작업을 좀 더 보기 좋게 시각화로 마무리 해 보자
여러 데이터 중에서 누락데이터나 아닌 것만 그래프로 표시해보겠다.
import matplotlib.pyplot as plt

resSer[resSer.notnull()].plot(kind='bar')
plt.show()
'|Playdata_study > Python' 카테고리의 다른 글
| 210722_NaN (누락데이터) (0) | 2021.07.23 |
|---|---|
| 210722_Pandas (DataFrame) (0) | 2021.07.23 |
| 210720_Numpy (array, random, 인덱싱, 슬라이싱) (0) | 2021.07.20 |
| 210512_웹 크롤링2 (0) | 2021.05.12 |
| 210511_웹 크롤링 (0) | 2021.05.11 |


댓글